
Nested data structures are a boon to modeling, storage, and query performance, but pose challenges to traditional BI tools. Here’s how to overcome them.

Over the past few years, there has been a subtle but significant shift in the way that data is structured in databases. Whereas yesterday’s databases were typically limited to storing data in rows and tables, today’s modern databases often make use of nested data structures.
In this article, we will take a deeper dive into the nature of nested data structures, how they are represented in different databases and the benefits and challenges of using nested data structures. Finally, we’ll propose an approach that addresses the challenge of marrying the traditional world of business intelligence with the modern world of nested data.
What is nested data?
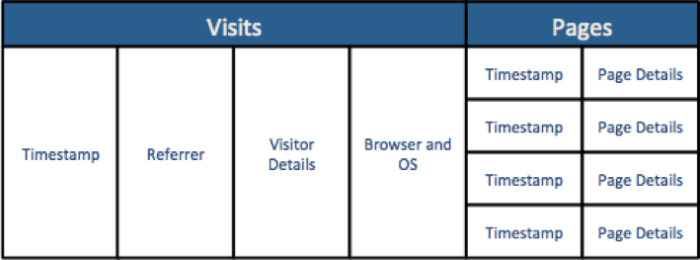
Let’s start with a little introduction to dimensional modeling, using a website visit as an example. There are measures of the visit that exist at the visit level, such as the number of visits and the length of the visit. There are also attributes of the visit that only exist at the visit level, such as the user’s IP address, browser type, and OS. There are also page views that occur as part of each visit, each with their own measures, for example, the number of page views and the time on page. And there are page view specific attributes, such as page name, page category, and page URL.
In the traditional world of the data mart or data warehouse design, a common approach to creating a model to support the analysis of this web data might be to create something that looks like the following (simplified) data model.

This type of “dimensional” modeling addresses a few challenges that occur when building models for business intelligence. First, it reduces the number of rows containing “duplicate” data: The visit fact doesn’t need to contain all of the page level details, meaning queries against the visit fact will perform better. Second, a dimensional model allows the use of a single key column (for example Browser_OS_Key) in the fact instead of multiple columns for each detail around browser and OS (versions, device, etc). This reduces the storage cost associated with the model. Third, this type of model can also improve query performance, especially for commonly used values (list of browsers, page categories, etc).
However, there are also challenges with this type of model. First, this approach is at odds with the “natural” form of weblog data (and with the machine and log data in general). Typically this type of data may be written to disk in the manner in which it occurs. For example, website logs may contain a record that looks like:
TimeStamp, VisitID, Referrer,UserAgentString, UserIP, CookieID, PageURL, PageName
The process of turning this data into the dimensional model shown above can be expensive and time-consuming. Additionally, the traditional dimensional data approach can lead to expensive queries, especially when those queries require joins in a distributed computing environment. Large joins—for example, joining billions of page view records with millions of user records—can be time-consuming, and will perform worse than the simple filter, scan, and aggregation operations on a single table.
The long-desired goal of network automation is coming closer to reality. But how close?
The past decade has seen several market shifts that have resulted in the emergence of a new approach to dealing with the data types and challenges described above. Specifically:
Vastly reduced storage costs: There has been a “race to zero” for storage costs. As a result, companies are no longer as intensely focused on reducing the cost of data warehouse and data mart models through key-based dimensional “denormalization” as they once were.
Adoption of columnar storage: As more and more databases and big data platforms support columnar storage, the real-time benefits provided by denormalization and dimensional models have also been reduced.
Expanded adoption of distributed databases: In the world of big data, distributed processing architectures (on-premises MPP databases like Greenplum, cloud databases like Redshift and BigQuery, Hadoop-based SQL engines like Hive and Impala) have become the rule, and not the exception.
An explosion of machine data: Sensor data, log data, and other machine data are increasingly the focus of analytical workloads, leading to an explosion in overall data volumes.
Nesting data within database records
As a result of the factors listed above, a new approach to storing and querying log data and machine-generated data in relational databases has emerged. While different databases have different implementations of this new approach, the general concept is the same, which is to support a single table where information is “nested” within records. Using the same example above, a nested model for a web session might look like the following conceptual diagram.
Because this nested approach stores all data as a set of discrete column elements in a single table, it addresses the challenges inherent in the traditional dimensional approach and achieves the following objectives:
- Reducing the bottlenecks and performance issues that result from doing large-scale joins.
- Taking advantage of columnar data formats for all data elements.
- Optimizing query performance for scans and aggregations at the expense of optimizing for storage costs.
- Reducing the amount of pre-processing required to query data in its “natural” form.
For more information on how this capability is supported by a number of modern big data platforms,
check out the following documents:
New in Cloudera Enterprise 5.5: Support for Complex Types in Impala
Snowflake Introduction to Semi-Structured Data
Google BigQuery: Specifying Nested and Repeated Columns
Support for nested data in these platforms makes modeling and storage decisions easier and also improves query performance. Nevertheless, there remain a number of challenges related to using this type of data in traditional analysis and BI scenarios. In the remainder of this article, we will discuss these challenges and the opportunities that exist when it comes to supporting BI and analytics workloads on these data structures.
For the purpose of this exercise, we will dive into how AtScale and BigQuery can be used together to analyze large-scale nested datasets.
Analyzing nested data in Google BigQuery
Google BigQuery is a modern, serverless, cloud-based data warehouse that has been architected to handle modern big data challenges, including working with nested datasets. While you can learn more about BigQuery’s nested data support here, we’ll run through a quick example using a sample Google Analytics (web analytics) data set.
nested data fig03AtScaleGoogle Analytics schema for BigQuery.
Let’s take a look at how BigQuery is able to store and query data that matches the session and page view example discussed above. With BigQuery’s support for nested data structures, it is possible to define a “nested” table structure with the schema shown at left.
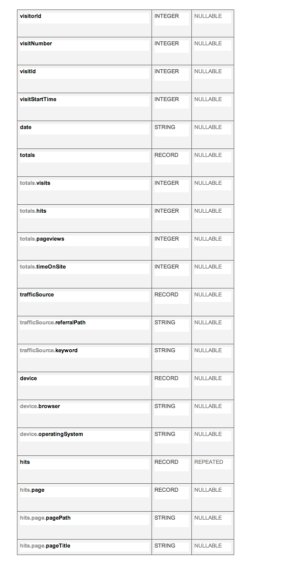
that a single record can be represented as shown below. Note
how there are multiple hits with different page paths nested within the same visit record.

When it comes to querying performance and simplicity, this structure has some very nice advantages. For example, it’s very easy to write a query that extracts the “landing” page for a visit, as show below:
Note that this query is able to reference the nested data by using the “dot” notation approach, and then no joins are required to combine page view level information with session level information. The other benefit of this structure is that query times are significantly faster, and there is no need to join together data from a session fact table and data from a page view fact table. In our internal testing of data structures with nested records that were able to avoid joins, we have seen data load time improvements ranging from 5X to 50X faster, and data read times of 2X to 80X faster. Clearly, nested data structures can yield huge benefits in a big data environment.
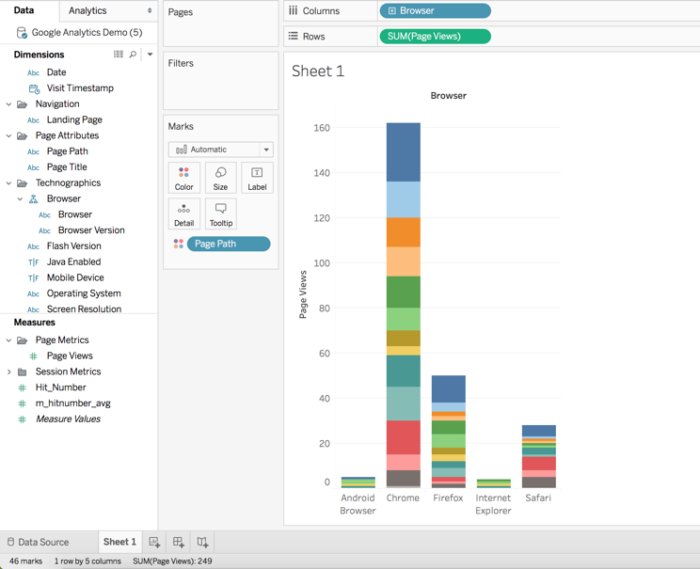
However, when it comes to using traditional data visualization and analysis tools to access this type of data structure, things get a little more complicated. Let’s take a look at what happens when you connect a tool like Tableau directly to nested datasets in Google BigQuery. In this first query, we will look at two “record level” values: the total page views for the visit and the browser used for the visit. Note that for the Chrome browser type there are 162 page views. On the lower left of the screen you can see that, in total, there were 249 page views for the visits being analyzed.
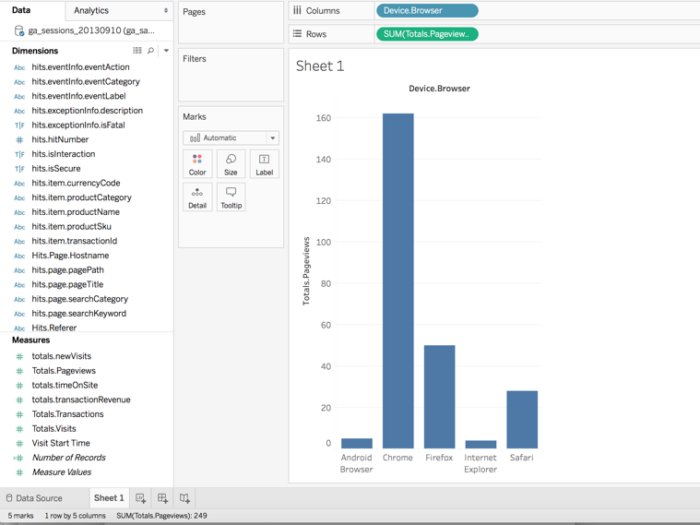
Let’s now dig a little deeper, and add “page path” to the colors shelf of the visualization. This should allow the user to break down the 162 Chrome visits to the specific pages (and associated page views) that were part of each visit.

Note that in this updated visualization, there are now almost 1800 page views for the Chrome browser and a total of 2,262 page views for the visits being analyzed. Clearly, this is the wrong result!
What’s the cause of this error? In the nested data set, the page views measure for the visit is recorded at the visit level. However, for each visit, there are multiple nested page path rows. As a result, when Tableau asks for the page view value for each nested page path record, there is duplicate counting of the visit level page view for each page path, resulting in overstated page view results.
This issue is a classic “multi-fact” model challenge that is traditionally resolved in business intelligence platforms by adding support for multilevel models (you can read more about this concept in this multilevel metrics blog). The screenshot below shows an AtScale multilevel model that has been constructed on the nested Google Analytics data set.

As you can see in this model, there are two “fact tables” that have been projected on top of the single Google Analytic nested dataset (using our Query Data Set, or QDS, functionality). There are also a number of shared dimensions between the sessions and page facts, as well as some dimensions that are only relevant to the page fact (including page path). In the preview panel, you can see that a Page Views measure has been clearly defined. Let’s redo the same Tableau analysis, but this time connecting to the scale virtual model.
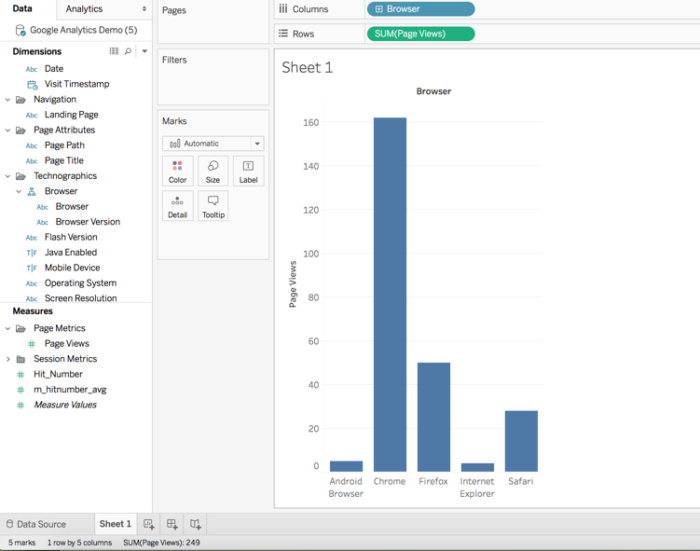
You can see in this visualization that we get the same session level results as before: 162 Chrome page views, and a total of 249 page views for all of the visits being analyzed. Now, let’s add page path to the analysis.
Note that in this scenario, the number of page views for Chrome has remained at 162, despite the fact that we are now looking at the nested page level records within the visit records. This is because the multi-level model has included the appropriate logic to avoid the duplicate counting of the page view records within the visit. The result is that Tableau users can seamlessly analyze nested Google Analytics data sets without needing to think about how the underlying data is stored, and benefitting from the great self-service data visualization capabilities of Tableau.
Old BI, new tricks
If you are an analytics or business intelligence practitioner, it behooves you to be aware of the increasing presence of nested datasets in modern data platforms, along with the benefits and challenges introduced by these types of data structures. While using nested data may make modeling and storage decisions easier and also improve query performance, there remain a number of challenges related to using this type of data in traditional analysis and BI scenarios.
With the increasing adoption of modern, cloud-based data platforms and the proliferation of machine-generated data, it’s clear that the ability to analyze nested data structures must be part of any business intelligence architecture. In this article, we introduced the concept of nested data, discussed the advantages, and highlighted some of the challenges in analyzing this type of data. And we illustrated one approach that allows organizations to take advantage of nested data support along with the ability to use the tools of choice for analysts and BI consumers.


No comments:
Post a Comment